WAMEX greatest hits part 1
- 3 minutes read - 444 wordsGood morning dataless geologists and geological software providers,
Andrew Waltho asked for open file training datasets as keen fan of WAMEX here is one of my favourite Anumbers A72391; The 2005 -2006 Central Chichester Ranges Report
As it is a relatively flat lying resource it would be excellent as an example for anyone looking for a simple geological model to build. It is also one of the few reports on WAMEX that contains metallurgical test work so that opens an interesting pathway for practicing metallurgical modelling.
So let’s begin by importing the required libraries.
pip install pandas matplotlib
pip install git+https://github.com/FractalGeoAnalytics/AuGeoscienceDataSets
And we can download the file from the dmp website:
# import into python the libraries that we need
from pathlib import Path
import shutil
from augeosciencedatasets import downloaders
import pandas as pd
# download the drilling data from DASC

filekey = 'https://geodocsget.dmirs.wa.gov.au/api/GeoDocsGet?filekey=4b03c1dc-5cf7-4a6d-8121-69daba4956ff-vlfu4wy9eo5pgeos5ueogu82xrz1d13j6v8yxvgk'
outpath = Path('data/FMG_Chichester')
if not outpath.exists():
    outpath.mkdir(parents=True)

outfile = outpath.joinpath('A072391_Drilling data_13100604.zip')
# download the file
downloaders.from_dasc(url=filekey,outfile=outfile)
# unpack the .zip file
shutil.unpack_archive(outfile,outpath)
Once the zip file has been unpacked we can now read each of the files into a pandas dataframe. Unfortunately the files are not quite conformant to the WADG etc formats so we will just skip the header and read with pandas.
# simple little function to cut or extend a list longer than the correct number of lines
def line_fixer(x,target_len=30):
    lx = len(x)
    if lx>target_len:
        y = x[0:target_len]
    elif lx<target_len:
        x = x.extend(['']*target_len-lx)
        y = x
    return y

assay = pd.read_csv(outpath.joinpath('C125_2006_WASL2_ASS2006A.txt'),skiprows=28,delimiter='\t',low_memory=False)
collars = pd.read_csv(outpath.joinpath('C125_2006_WASL2_COL2006A.txt'),skiprows=28,delimiter='\t',skip_blank_lines=True,low_memory=False)
geo = pd.read_csv(outpath.joinpath('C125_2006_WASL2_GEO2006A.txt'),skiprows=28,delimiter='\t',skip_blank_lines=True,on_bad_lines=lambda x: line_fixer(x,30),engine='python',encoding_errors='replace')
met = pd.read_csv(outpath.joinpath('C125_2006_WASL2_MET2006A.txt'),skiprows=29,delimiter='\t',skip_blank_lines=True,on_bad_lines=lambda x: line_fixer(x, 56),engine='python')
survey_columns = 'HOLEID PROJECTCODE GEOLFROM GEOLTO PRIORITY Gamma MagSusc Caliper Density'.split(' ')
survey = pd.read_csv(outpath.joinpath('C125_2006_WASL2_SURV2006A.txt'),skiprows=32,delimiter='\t',names=survey_columns,header=None,low_memory=False)

# clean the met names
met_names =[i.replace('\n','_') for i in met.columns.to_list()]
clean_met_names = []
for i in met_names:
    if i.find('.1') >=0:
        tmp_clean = i.replace('.1','_Lump')
    elif i.find('.2')>=0:
        tmp_clean = i.replace('.2','_Head')
    else:
        tmp_clean = i
    clean_met_names.append(tmp_clean)

met.columns=clean_met_names
assay.to_csv(outpath.joinpath('Assay.csv'),index=False)
collars.to_csv(outpath.joinpath('Collars.csv'),index=False)
survey.to_csv(outpath.joinpath('Wireline.csv'),index=False)
met.to_csv(outpath.joinpath('Met.csv'),index=False)
geo.to_csv(outpath.joinpath('Geo.csv'),index=False)
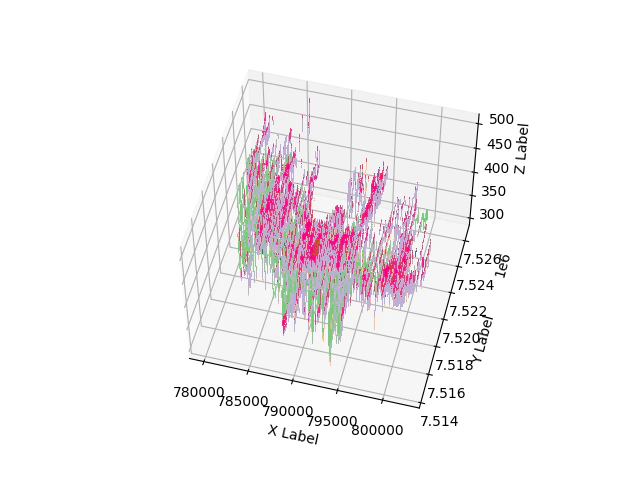
Now let’s plot stuff to see if it looks OK just because there is a lot of data we are going to cut it down a little.
# slice a small section to have a look
min_east = 780000
cidx = collars.EAST>=min_east
col = collars[cidx]
# lazy desurvey all holes are vertical
# merge the data collars and geology
data  = pd.merge(geo, col)
data['SAMPLE_LENGTH'] = data.GEOLTO-data.GEOLFROM
data['Z'] = data.RL-(data.GEOLFROM+data['SAMPLE_LENGTH']/2)
data.reset_index()

# 3d plotting of geology in matplotlib
import matplotlib.pyplot as plt
from   matplotlib.cm import get_cmap
FMG_strat_column = ['Ta','Tdi','Tds','Tdm','CID','Te','To','Hc','Hso','Cf','MUh','MUm','MUf','MUs','MUk','MUt','MUb','Jr','Fj']
FMG_simple = {'Ta':'T','Tdi':'T','Tds':'T','Tdm':'T','CID':'T','Te':'T','To':'T','Hc':'H','Hso':'H','Cf':'Cf','MUh':'M','MUm':'M','MUf':'M','MUs':'M','MUk':'M','MUt':'M','MUb':'M','Jr':'J','Fj':'F'}
# too many units just simplify
data.Simple = data.Strat.map(FMG_simple)
cm= get_cmap('Accent', len(data.Simple.unique()))
fig = plt.figure()
ax = fig.add_subplot(projection='3d')
for n,i in enumerate(data.Simple.unique()):
    idx = data.Simple == i
    ax.plot(data[idx].EAST, data[idx].NORTH,data[idx].Z,',',c=cm(n))
ax.set_xlabel('X Label')
ax.set_ylabel('Y Label')
ax.set_zlabel('Z Label')
plt.show()
