MWD cavity detection and background rates Part 3
- 3 minutes read - 549 wordsHi All,
In this article we are going to integrate our estimate of background rate of cavities from caliper data we modelled in Part 1 with the likelyhood of detecting a cavity by drillhole spacing we generated in Part 2 .
One of the issues with the simulation modelling estimating the background rates in Part 1 was the estimate of cavity distribution was done for the entire data set. As this is an Iron Ore data set from open file WAMEX data I know from experience that there are more cavities in certain stratigraphic units and alteration zones (hard cap).
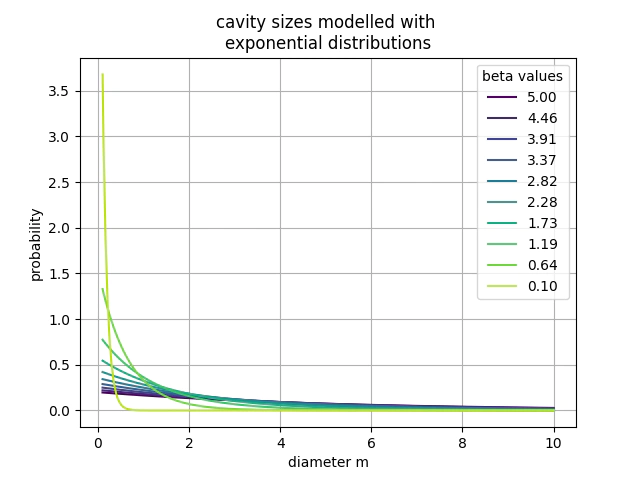
So to show a range of outcomes I will run a series of different distributions representing the size of cavities to demonstrate the uncertainty of the assumptions. The figure below models a range of exponential distributions to help grasp how the size probability distribution changes by the decay value (beta) it should be noted that changing the beta shifts the curve around significantly so your risk will change depending on the how your cavities are distributed.

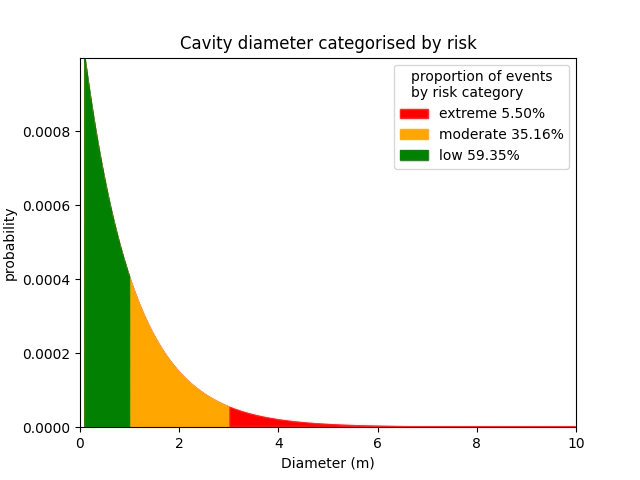
It should be noted that the size of the cavity is effectively the consequence axis of the risk matrix as larger cavities are likely to be large enough to be an engulfment/ground collapse risk. To demonstrate that relationship see the figure below.

Each of the coloured bins are a risk category, the boundaries were determined by the following logic:
- cavities smaller than 1m were assumed to be problematic for drill and blast.
- cavities larger than 1m were assumed to be able to cause material injury to personel.
- cavities larger than 3m were assumed to be able to cause problems for SME on the bench.
The proportions reported in the figure are the total area under the curve for each of the categories before any risk mitigation actions.
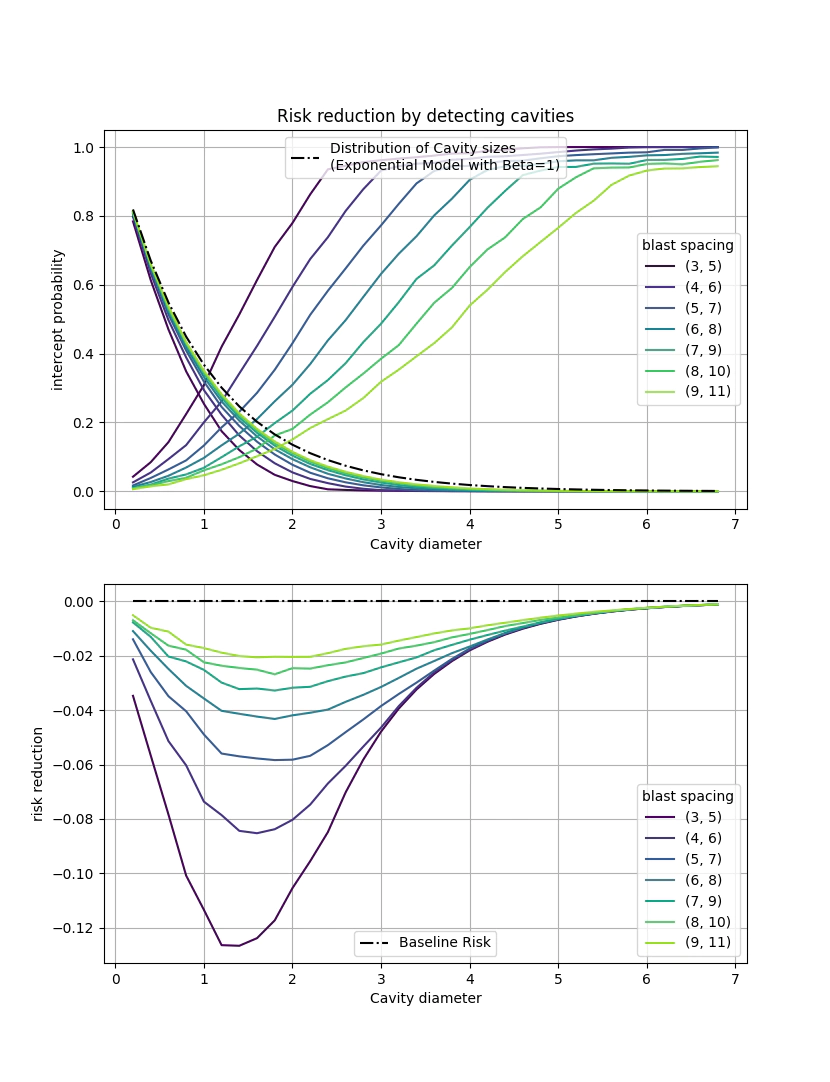
Moving onto the potential risk reduction using MWD to detect cavities. To do that we are going to multiply the chance of detection by the distribution of cavities and that results in the outcome in the figure below:

The top panel from the above figure is the absolute risk reduction for a cavity size distribution for a series of blast pattern spacings. The bottom panel is the risk reduction against the baseline of no control.
Let’s talk about some of the results in the figure:
- Risk reduction for large cavities is small even though they are effectively 100% detectable in this model as they are low probability events.
- Tighter spacings have better risk reductions.
- Small cavities less than 1m diameter don’t have a significant reduction in risk because there are so many and they are not well detected.
- Moderate cavities have the highest risk reduction.
To end this post MWD has the potential to offer a risk reduction by identifing cavities in the ground before blasting, however it should be noted that in the scenarios above we are assuming that we have perfect detection of cavities. Most of the MWD systems that I have dealt with have have issues data reliability and consistency, ideally we would modify the spacing in areas where we were concerned that there was a higher rate of cavities but that would come with significantly increased cost.
In the next post I’ll discuss some options to better constrain these estimates.
Thanks,
Ben.