Estimating RC recovery
- 4 minutes read - 745 words
An estimation of RC recovery is needed to assess how representative the sample is of the ground that is extracted from.
In iron ore the density of the material is an important consideration when assessing how much of the material has made it to the top of the hole. As downhole density variations can make considerable differences in apparent recovery.
Contents
So in this example we are going to:
- Configure Python
- Download the open file data
- Composite the wireline density to the assay intervals
- Solve a sufficient set of minerals for sanity checking
- Calculate the mass of the interval
- Make an estimate of the recovery.
As usual we are using open file data in this case the 2014 Roy Hill Annual Report
Configure Python
Let’s first install the required packages.
pip install git+https://github.com/FractalGeoAnalytics/AuGeoscienceDataSets
pip install git+https://github.com/FractalGeoAnalytics/pydhc
pip install matplotlib numpy pandas scikit-learn
Download data
We now will download the required data from DMIRS and unzip the package.
from pathlib import Path
import shutil
import numpy as np
from augeosciencedatasets import downloaders
from augeosciencedatasets import readers
import pandas as pd
from matplotlib import pyplot as plt
import pydhc

# download the drilling data from DASC
outpath = Path('data/drill hole data/drillcore geochem')
dasc_url = "https://geodocsget.dmirs.wa.gov.au/api/GeoDocsGet?filekey=4176a02b-1d7e-49fd-b725-36427e646200-zkectqkylt37561ucrzskmj5nsri06i9nff0jrkt"
outfile = outpath.joinpath('A101166_Drilling_13339409.ZIP')
downloaders.from_dasc(dasc_url,outfile)

# unzip the zip file
shutil.unpack_archive(outfile,outpath)
Let’s import the downloaded data.
# configure the path for the data
assay_path = outpath.joinpath('RH_WADG3_ASS2014 .txt')
geop_path = outpath.joinpath('RH_WADS3_GPH2014.txt')

# read in the data
assay,_ = readers.dmp(assay_path)
geop,_ = readers.dmp(geop_path)
# clean the geophysics
geop.Density_Best = geop.Density_Best.astype(float)
geop['Depth From'] = geop['Depth From'].astype(float)
geop['Depth To']= geop['Depth To'].astype(float)
geop.Density_Best[geop.Density_Best  < 0] = np.nan

# clean the assay data
def map_float(x):
    try:
        y = float(x)
    except:
        y = np.nan
    return y


def clean_columns(x):
    return x.replace('_XRF78L_pct','').replace('_WGH79_g','')

assay.columns = assay.columns.map(clean_columns)
float_cols = ['Depth From', 'Depth To', 'As', 'Ba', 'CaO', 'Cl', 'Co', 'Cr', 'Cu', 'Fe', 'K2O',
                'LOI1000', 'LOI110', 'LOI425', 'LOI650', 'MgO', 'Mn', 'Na2O', 'Ni', 'P',
                'Pb', 'S_CSA06V_pct', 'S', 'SiO2', 'Sn', 'Sr', 'TiO2', 'V', 'WtRec',
                'WtSpl', 'Zn', 'Zr']
assay[float_cols] = assay[float_cols].applymap(map_float,None)
Composite Wireline
Now we composite the wireline density to the assay intervals so that we can estimate the expected mass of the interval.
# set Density and coverage columns in the assay dataframe.
# set nan values to the density as the default i.e. no measurement
assay['Density'] = np.nan
# set the default coverage to 0 which should return np.nan
assay['Coverage'] = 0
# loop over each of the holenames in the assay table
# and for each of these calculate the weighted averaege of the densit.
for i in assay.Hole_id.unique():
    idx_geop = geop.Hole_id == i
    if np.any(idx_geop):
        idx_assay = assay.Hole_id == i
        cfrom = assay['Depth From'][idx_assay].values
        cto   = assay['Depth To'][idx_assay].values
        samplefrom = geop['Depth From'][idx_geop].values
        sampleto   = geop['Depth To'][idx_geop].values+0.1
        array = geop['Density_Best'][idx_geop].values.reshape(-1,1)
        cv,coverage = composite(cfrom, cto,samplefrom ,sampleto, array)
        assay.loc[idx_assay,'Density'] = cv
        assay.loc[idx_assay,'Coverage'] = coverage
Mineralogy
We are going to solve the mineralogy, using the method outlined in the previous post to determine if there is any relationship between the composition of the interval and the recovery.
clean_ass = assay[['Fe','SiO2', 'LOI425', 'LOI650','LOI1000']]
clean_ass = clean_ass.applymap(map_float,None)
mineral_data = pd.DataFrame([{'Mineral':'Goethite'   , 'Fe':0.6285,'SiO2':0,'LOI425':0.1013,'LOI650':0,'LOI1000':0},
                                {'Mineral':'Hematite','Fe':0.6994,'SiO2':0,'LOI425':0,'LOI650':0,'LOI1000':0},
                                {'Mineral':'Kaolinite','Fe':0     ,'SiO2':0.4654,'LOI425':0,'LOI650':0.1395,'LOI1000':0},
                                {'Mineral':'Quartz'   , 'Fe':0     ,'SiO2':1,'LOI425':0,'LOI650':0,'LOI1000':0}])
min_el = mineral_data.columns[1:]

mineral_array = mineral_data[min_el].values

cm = clean_ass[min_el].values/100

n_minerals = mineral_array.shape[0]
n_assay = cm.shape[0]
mineral_solution = np.zeros((n_assay, n_minerals))
for j,i in enumerate(mineral_array):
    mult_idx = i>0
    n_elems = np.sum(mult_idx)
    mineral_lim = np.min(cm[:,mult_idx]/i[mult_idx],1)
    mineral_lim = np.clip(mineral_lim,0,1)
    remaining_element = i[mult_idx].reshape(-1,n_elems)*mineral_lim.reshape(-1,1)
    cm[:,mult_idx] = cm[:,mult_idx]-remaining_element
    mineral_solution[:,j] = mineral_lim

mineral_solution[mineral_solution<0] =0
# multiply each of the minerals by a very approximate density.
sg = np.sum(mineral_solution*np.asarray([3.8,5.1, 2.65,2.3]),1)
assay['SG'] = sg
Calculate the mass of the interval
Let’s now calculate the mass of the interval, we need this and the mass of the recovered sample to estimate the recovery of an interval.
# calculate the interval volumes
# sample length
assay['Length'] = assay['Depth To']-assay['Depth From']
# lot volume
assay['LotVolumeCC'] = np.pi*(13/2)**2*assay['Length']*100
# lot mass
assay['LotMassKG'] = assay['Volume']*assay['Density']/1000
# sample recovered volume
assay['SampleVolumeCC'] = assay['WtRec']/assay['Density']
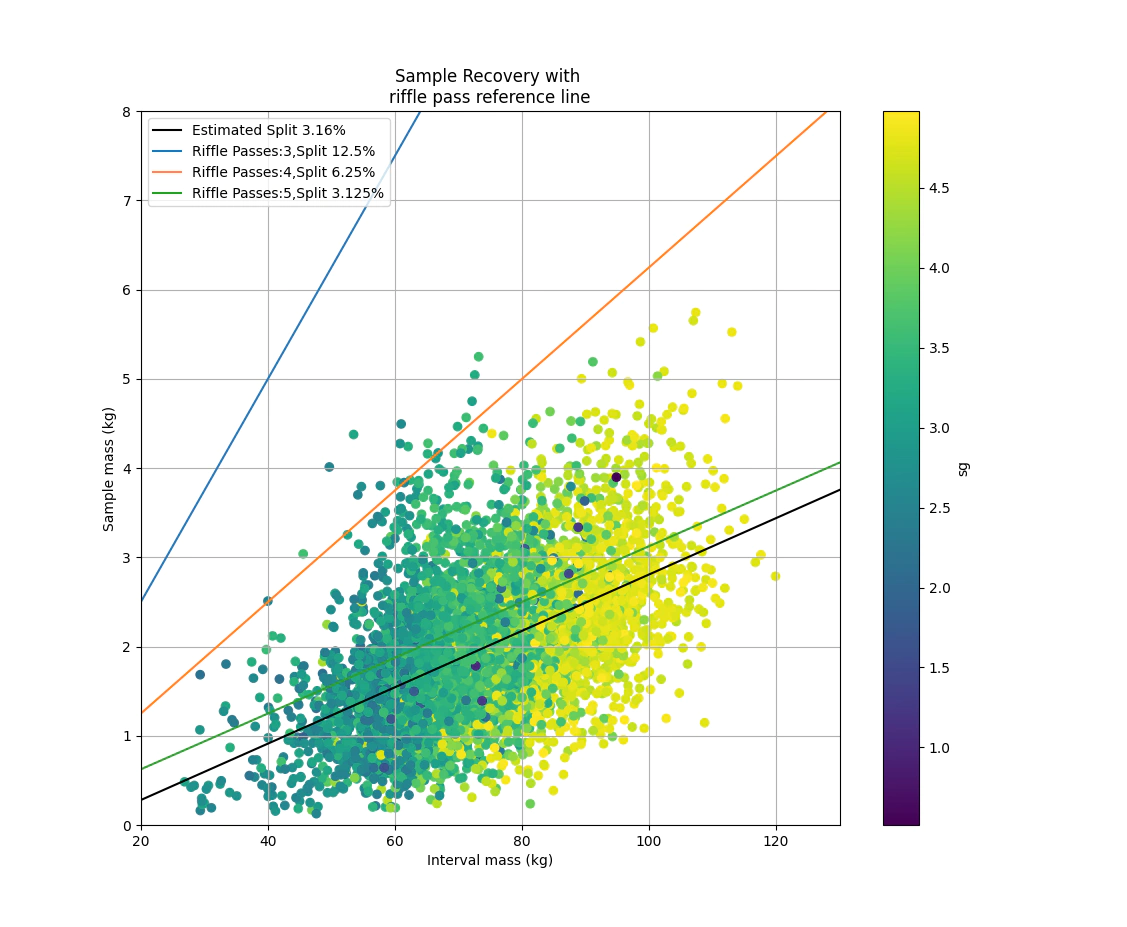
Finally we can plot up the data and see what level of recovery that we have and check that we have the expected relationship of heavier samples corresponding to denser material. Ideally the fit line should be pretty close to one of the reference riffle split lines as well.

# remove nan values
idxok = np.all(np.isfinite(assay[['LotMassKG','WtRec']].values),1)
# fit a regression using numpy
f1 = np.polyfit(assay['LotMassKG'][idxok],assay.WtRec[idxok]/1000,1)

plt.scatter(assay['LotMassKG'],assay.WtRec/1000,  c=assay.SG)
estimate_label ='Estimated Split {:.3}%'.format(f1[0]*100)
plt.plot(np.polyval(f1, np.arange(0,150)),'k',label=estimate_label)
for i in range(3,6):
    factor = 1/(2**i)
    label_text = f'Riffle Passes:{i},Split {factor*100}%'
    plt.plot(np.polyval([factor, 0], np.arange(0,150)),label=label_text)
plt.grid()
plt.xlabel('Interval mass (kg)')
plt.ylabel('Sample mass (kg)')
plt.title('Sample Recovery with \nriffle pass reference line')
plt.colorbar(label='sg')
plt.legend()
plt.show()