compositing drill hole intervals
- 6 minutes read - 1136 wordsWhy dhcomp
It’s 2023 and there were still no python libraries that you can pip install to composite drill hole intervals.
To fix this I have released dhcomp on pypi as an MIT licenced library to composite drill hole intervals and other irregular spaced time series data.
For anyone on wondering why should you use dhcomp:
- you can pip install it
- permissive licence
- it doesn’t require your intervals to be ordered or unique
- fast
- works on 3d arrays
- let’s you calculate a weighted average with soft boundaries
- deals with missing data for you
As fair warning I have only required compositing that correctly calculates a weighted average for the soft boundary condition. i.e. if the data that you wish to composite straddles a boundary it’s value will be allocated to any sample that it sits across, this is correct or close enough for most wireline data and probably stratigraphy.
Physical samples should not break across boundaries. If you would not like your assays split across the boundary you must provide intervals that honour boundaries.
With that warning aside…you can finally pip install dhcomp for all your interval compositing needs, so let’s run through a few examples.
Contents
- Get Data
- Configure Python
- Read the data
- Soft Boundary Compositing
- Composite Stratigraphy
- Merge Stratigraphy, Assay and Wireline
- with pandas [
- [with numpy](#3numpy)
- [Merge two irregular time series](#timeseries)
Get Data
Our example data is taken from a previous post on some of the more complete datasets available in WAMEX you will need the data from that post to run this example so please run that example first.](ore_sorting.py)
Configure Python
Let’s install the libraries we need for this example
pip install matplotlib dhcomp pandas
Read in the example data and clean up
from pathlib import Path
import pandas as pd
from dhcomp.composite import composite, SoftComposite

outpath = Path('data/FMG_Chichester')

#read in some assay data
assay = pd.read_csv(outpath.joinpath('Assay.csv'),low_memory=False)
wireline = pd.read_csv(outpath.joinpath('Wireline.csv'))
collars = pd.read_csv(outpath.joinpath('Collars.csv'),low_memory=False)
# collars has some empty rows we need to drop them to remove downstream issues
collars = collars.dropna()
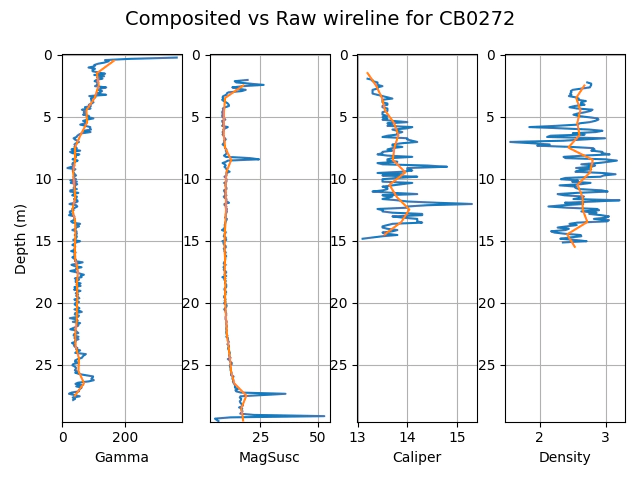
Use the SoftBoundary interface to composite high resolution data to 1m
dhcomp has a simple interface for the compositing of high resolution data to larger intervals as we can see in the example below.
It also manages the missing sections from the top and bottom of the logs for you.

# geophysical data columns
geop_columns = ['Gamma', 'MagSusc', 'Caliper','Density']
wireline[wireline[geop_columns]<0] = np.nan

borehole = 'CB0272'
widx = wireline.HOLEID.isin([borehole])
dfr = wireline[widx].GEOLFROM.values[0:-1]
dto = wireline[widx].GEOLFROM.values[1:]
tmp = wireline.loc[widx,['Gamma', 'MagSusc', 'Caliper','Density']][0:-1]
# set the composite interval something smaller than the sample frequency to upscale your data.
composite_interval = 1
dtmp, atmp, ctmp = SoftComposite(dfr, dto,tmp,composite_interval,drop_empty_intervals=False)

xrange = (0,max(dto))
for i,name in enumerate(geop_columns):
    plt.subplot( 1,4, i+1)
    plt.plot(tmp[name],dfr+0.05)
    plt.plot(atmp[name],dtmp[:,0]+composite_interval/2)
    plt.xlabel(name)
    plt.ylim(xrange)
    plt.gca().invert_yaxis()
    plt.grid()
    if i == 0:
        plt.ylabel('Depth (m)')

fig = plt.gcf()
fig.suptitle(f"Composited vs Raw wireline for {borehole}", fontsize=14)
fig.tight_layout(w_pad=0)
plt.show()
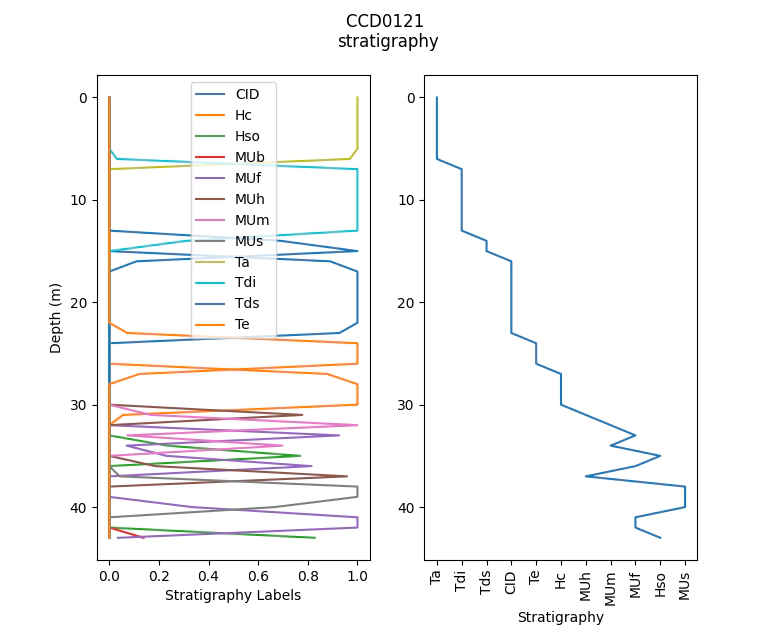
Compositing stratigraphy

We can use dhcomp to aggregate data such as stratigraphy or other text based data. To do so we need to first one-hot encode the text data.
If you need majority coded strat we post process the pd.DataFrame
# the geo.csv data is a mixture of the stratigraphy
# and geological logging in a single file the quickest
# way to clean this up is to remove the nan rows like so
geo_columns = ['HOLEID', 'PROJECTCODE', 'GEOLFROM', 'GEOLTO', 'Strat_Sum']
stratigraphy = geo[geo_columns].dropna().reset_index(drop=True)
borehole = 'CCD0121'
strat_idx = stratigraphy.HOLEID == borehole
strat_tmp = stratigraphy[strat_idx].reset_index(drop=True)
strat_depths, strat_comp, strat_coverage = SoftComposite(strat_tmp.GEOLFROM, strat_tmp.GEOLTO,pd.get_dummies(strat_tmp['Strat_Sum']))

# to get majority coded strat we simply post process the data
MajorStrat = strat_comp.idxmax(1)
MajorProportion = strat_comp.max(1)

plt.subplot(1,2,1)
plt.plot(strat_comp,strat_depths[:,0],label=strat_comp.columns)
plt.gca().invert_yaxis()
plt.legend()
plt.xlabel('Stratigraphy Labels')
plt.ylabel('Depth (m)')
plt.subplot(1,2,2)
plt.plot(MajorStrat,strat_depths[:,0])
plt.xlabel('Stratigraphy')
plt.xticks(rotation=90)

plt.gca().invert_yaxis()
plt.suptitle(f'{borehole} \nstratigraphy')
plt.show()
Merge stratigraphy, assay and geophysics
dhcomp only allows for a 2way merge so to create a more complete dataset for ML we will merge all the data into a single table.
As a bonus I demonstrate two ways to do the same process, the first with pandas the second using numpy directly for you impatient people. I get approximately 10x speed up on my laptop so 7 minutes to 42 seconds.
merging with pandas 🐌
ncolumns = len(geop_columns)
c_geophysics = ncolumns

r = assay.shape[0]

dummy_strat = pd.get_dummies(stratigraphy['Strat_Sum'])
c_strat = dummy_strat.shape[1]

geophysics_composites = np.ones((r, c_geophysics))*np.nan
strat_composites = np.ones((r, c_strat))*np.nan

start_pd = datetime.now()
# this is slow because we are indexing with pandas
for i in ubhid:
    widx = wireline.HOLEID == i
    aidx = assay.HOLEID == i
    sidx = stratigraphy.HOLEID == i
    if any(aidx):
        composite_from = assay.SAMPFROM.values[aidx]
        composite_to = assay.SAMPTO.values[aidx]

    if any(widx) and any(aidx):
        dfr = wireline[widx].GEOLFROM.values[0:-1]
        dto = wireline[widx].GEOLFROM.values[1:]
        tmp = wireline.loc[widx,geop_columns][0:-1].values
        tmp_comp, tmp_coverage = composite(composite_from, composite_to, dfr, dto, tmp)
        geophysics_composites[aidx.values,:] = tmp_comp
        print(f'wire{i}')
    if any(aidx) and any(sidx):
        dfr = stratigraphy[sidx].GEOLFROM.values
        dto = stratigraphy[sidx].GEOLTO.values
        tmp = dummy_strat.loc[sidx]
        tmp_comp, tmp_coverage = composite(composite_from, composite_to, dfr, dto, tmp.values)
        strat_composites[aidx.values,:] = tmp_comp
        print(f'strat{i}\n')

end_pd = datetime.now()
print(end_pd-start_pd)
merging with numpy 🔥
# lets make stuff faster and use np arrays directly
# step 1 map the bhids to ints
# for a fair comparison we will include all the numpy pre-processing
ncolumns = len(geop_columns)
c_geophysics = ncolumns

r = assay.shape[0]

dummy_strat = pd.get_dummies(stratigraphy['Strat_Sum'])
c_strat = dummy_strat.shape[1]

geophysics_composites = np.ones((r, c_geophysics))*np.nan
strat_composites = np.ones((r, c_strat))*np.nan

start_np = datetime.now()
bhid_map = {ubhid[i]:i for i  in range(len(ubhid))}
wire_bhid_int = wireline.HOLEID.map(bhid_map).values
assay_bhid_int = assay.HOLEID.map(bhid_map).values
strat_bhid_int = stratigraphy.HOLEID.map(bhid_map).values
# step 2 only iterate over the bhids that match
# keep only the intersection of the bhids
# step 3 extract the pandas columns to np.arrays
# because indexing is faster
assayfromto = assay[['SAMPFROM', 'SAMPTO']].values
wirefromto = wireline[['GEOLFROM']].values
wiredata = wireline[geop_columns].values
stratfromto = stratigraphy[['GEOLFROM','GEOLTO']].values
stratpd = pd.get_dummies(stratigraphy['Strat_Sum'])
strat_data = stratpd.values
for i in range(len(ubhid)):
    widx = wire_bhid_int == i
    aidx = assay_bhid_int == i
    sidx = strat_bhid_int == i
    if np.any(aidx):
        composite_from = assayfromto[aidx,0]
        composite_to = assayfromto[aidx,1]
        if np.any(widx):
            dfr = wirefromto[widx][0:-1]
            dto = wirefromto[widx][1:]
            tmp = wiredata[widx][0:-1,:]
            tmp_comp, tmp_coverage = composite(composite_from, composite_to, dfr, dto, tmp)
            geophysics_composites[aidx,:] = tmp_comp

        if np.any(sidx):

            tmp = strat_data[sidx]
            sfr = stratfromto[sidx,0]
            sto = stratfromto[sidx,1]
            tmp_comp, tmp_coverage = composite(composite_from, composite_to, sfr, sto, tmp)
            strat_composites[aidx,:] = tmp_comp

# make up the data
composited_data = pd.DataFrame(np.hstack([geophysics_composites, strat_composites]), columns=[*geop_columns, *stratpd.columns])

end_np = datetime.now()

print(end_np-start_np)
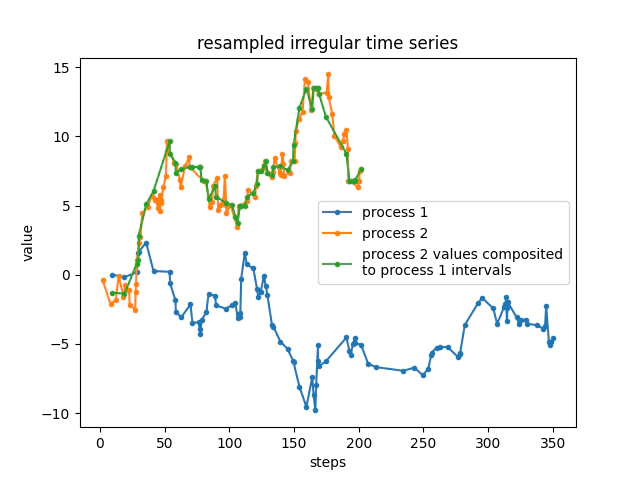
Merge two irregularly spaced time series
Every once in a while you might need to take a weighed average between two irregularly spaced time intervals, such as truck tip information and sample station intervals. dhcomp enables these types of merges.

## random stuff
import numpy as np
rng = np.random.default_rng(42)
nsteps = 100
int_1 = rng.gamma(1,4,nsteps)
int_2 = rng.gamma(1,2,nsteps)

def create_intervals(rnums):

    tmp = np.cumsum(rnums)
    # wrap the result
    fr = tmp[0:-1]
    to = tmp[1:]
    return fr, to

fr1, to1 = create_intervals(int_1)
fr2, to2 = create_intervals(int_2)
# use nsteps-1 because we loose a step
v1 = np.cumsum(rng.standard_normal(nsteps-1))
v2 = np.cumsum(rng.standard_normal(nsteps-1))
c2,_ = composite(fr1, to1, fr2, to2, v2.reshape(-1,1))

plt.plot(fr1,v1,'.-',label='process 1')
plt.plot(fr2,v2,'.-',label='process 2')
plt.plot(fr1,c2,'.-',label='process 2 values composited\nto process 1 intervals')
plt.legend()
plt.xlabel('steps')
plt.ylabel('value')
plt.title('resampled irregular time series')
plt.show()